North Carolina’s Health Secretary Mandy Cohen raised the possibility of re-issuing stay-at-home orders after the state saw five record breaking days subsequent to its May 22 reopening, including 1,430 cases yesterday, a state record. If they were to again order the state or certain counties closed, there may be quite a few people who refuse to comply. The state recently sued to shut down a race track that had reopened despite the government’s order to remain closed.
In Texas, reopening continues, moving to Phase 3, even as cases rise with active clusters around Dallas, Houston, Austin and San Antonio. Yesterday, the state had 1,826 new cases, or about eight percent of the nation’s total. To put this in perspective, New York had only 736 new cases.
Florida also set a record yesterday with 1,698 new cases. California, saw 3,570 new cases yesterday, its second highest total ever, and leads the nation in new cases.
Reported cases of COVID-19 in the U.S. climbed 23,200 in the past 24 hours, an increase of 1.1 percent. There were 803 deaths attributed to the coronavirus, bringing the total to 113,900.
The Actions Moves South
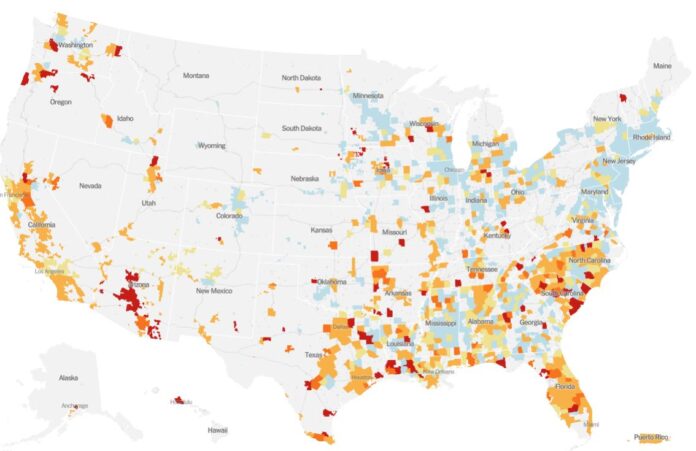
As you can see in the map at the top of this post, which is produced by the New York Times, the North East is continuing to see cases diminish (blue) while the orange and red show the counties with the highest growth. As we said yesterday, the South from the Carolinas down to Florida and over to Texas is becoming the new focal point for coronavirus spread, followed by Arizona, California, and parts of the Pacific Northwest.
When there is an occasional orange or red block, it is usually attributed to an outbreak in a facility like a prison, meat packing plant or even a nursing home. When there is a wider block of color, it tends to reflect community spread and is harder to mitigate or control.
Global Growth
Brazil topped 800,000 cases and continues to lead the world with the most reported cases per day. Globally, there were 141,000 new cases, bringing the total to 7.55 million. Deaths climbed 4,759 to 422, 136, according to data from Johns Hopkins.
Check back with us tomorrow as we expect to publish our updated global chart showing the growth over the top countries on a week-over-week basis.
To see a chart of how state growth over the period of a week, refer to yesterday’s report.


