Editor’s Note: after a three-day trip with no WiFi or Internet the entire time, we are resuming our regular COVID-19 coverage. After more than 90 days straight of posts, it was a nice break. Check back late Sunday night or Monday for the full story.
Cases vs. Deaths
Reported cases of coronavirus in the U.S. have grown to 2,265,200 while deaths are 119,710.
Data from the New York Times (see charts, above) shows that coronavirus cases in the U.S. have been growing for six days straight, culminating with 31,888 new cases yesterday and dragging the 7-day moving average upwards at a rate not seen since a spike in late April. Interestingly, and perhaps reassuringly, deaths continue to drop.
We might expect to see a commensurate increase in deaths in two or three weeks, but we’ve been expecting an increase in deaths ever since the first state reopened and they have not manifested. This points to one of two things: Either testing is uncovering more cases with minimal or no symptoms (which is what many health directors have been saying), or the virus is more survivable. This could be due to improved treatment regimens or simply that a younger, more resilient population is getting the disease.
The American Institute for Economic Research reports that not only is the virus causing fewer deaths, but fewer hospitalizations. The total number of COVID-19 case in the U.S. has dropped from its peak of 60,000 in mid-April to less than half that today.
New York Numbers
We haven’t talked much about New York lately, mainly because they have done such a fine job stamping out COVID-19 that they don’t generate as much news as when cases there were spiking. Cases, deaths and hospitalizations in New York continue to drop. Most impressive is their recent testing data: Yesterday, the state reported 68,830 tests and 716 positives. That’s a positive-test rate of just over 1 percent. Two months ago, their positive rate was about 27 percent.
Compare this 1 percent rate to states where the virus is still growing, which are reporting rates of up to 10 percent. For example, North Carolina, where the curve is still heading upward, conducted 19,028 tests and had 1,549 confirmed cases, a rage just over 8 percent.
It’s also interesting to note than New York has conducted 3.3 million tests, while the entire U.S. has reported 26 million, meaning that the state has conducted about 12 percent of all testing done in the U.S. That sound like a pretty big percentage until you remember that New York has account for 17.4 percent of the countries cases.
Global Data
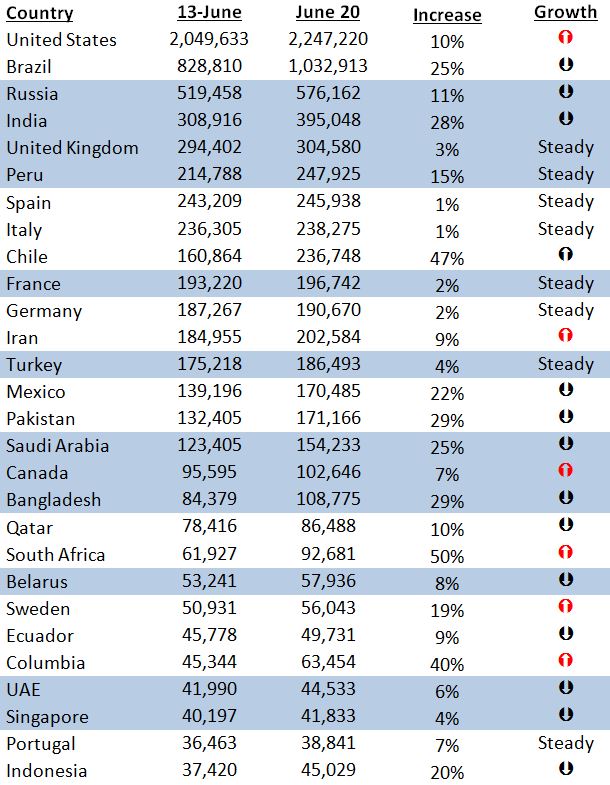
Worldwide, there have been 8.815 million cases of COVID-19 reported with 464,895 deaths. As you can see in the chart below, Brazil has passed the 1 million mark while Russia now has more than 500,000 cases, more than twice Spain and Ital which were once epicenters of the European outbreak. Of course, Russia has a population about three times that of Spain, so the Russian data actually translates into a lower percentage of the population becoming sick.
Here is a global report on the top countries, for the week ending yesterday:

The first thing of note is that the U.S. is showing a week-over-week increase in the rate of case growth for the first time in months. This 10 percent figure is up from 8 percent last week.
South America Surges
Also important to note is how quickly the virus is growing in South America. In addition to Brazil’s million cases and 25 percent rate of growth, Peru has leapfrogged Span and Italy to take over as the country with the six largest COVID-19 outbreak. By next week, Chile, were cases have grown 47 percent in the last week, will have also surpassed Italy and Spain, and possibly exceeded the number of cases in Peru. Also notable is Columbia’s growth rate of 40 percent.
One has to question whether the coronavirus was simply late in reaching these countries, or if their presence in the Southern Hemisphere, where it is the Winter Solstice, has something to do with the increased rate of growth. Certainly the growth in countries like India, Pakistan and Bangladesh, would argue that it is not seasonal. It may take months or even another year, to generate significant proof that seasonality plays a role.
To put these numbers in perspective, you can review data from a week ago or a month ago, when the world had just hit 5 million cases.


