
As more states relax shutdown rules and allow more businesses to reopening, the virus marches on. Reported cases of Coronavirus in the U.S. were up 24,700 in the past 24 hours to 1,211,600, an increase of 2.1 percent. That’s an increase of 200,000 in the past week.
Deaths jumped 2,290, the first day over 2,000 after a four-day streak below that number. The reported death toll from COVID-19 in the U.S. is 71,133, an increase of 18,099 in the past week.
Globally, reported cases increase 82,000, or 2.2 percent, to 3.690 million. Deaths were up by roughly 6,000 to 258,160. Russia and Brazil continue are the current epicenters for coronavirus growth. The UK, with 29,501 deaths, has passed reported death Italy and Spain and is second behind the U.S. Again, these are reported numbers and reporting criteria and accuracy may vary from country to country.
Gauging The Economic Cost
There is an interesting model from the Wharton School of Business at the University of Pennsylvania that looks at the economic toll of delayed reopening versus the deaths attributed to early reopening.
Our opening graphic from CBS Philadelphia summarizes those results in a single chart. Of course, there is no guarantee that either the epidemiological data in this model is any more accurate than in other models, but the loss of 18 million jobs would have a HUGE impact on the financial health of the country and the duration and severity of the coming recession.
One should note that the 350,000 deaths for reopening is not new deaths, but total death through the end of June. To be consistent with how the data is presented in Scenario 1 and 2, Scenario 3 should read 280,000 additional deaths
State Report
The New York Times continues to adjust its list of states where the virus is increasing, steady or decreasing. Today’s numbers are:
Increasing: 23
Steady: 14
Decreasing: 16
Here’s how the states with the highest number of cases have performed in the past week:
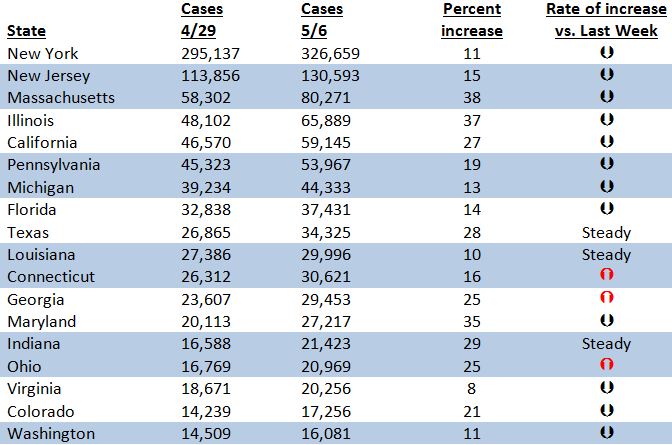
It’s interesting to note that of the three states that saw their rate of growth this past week remain steady with the week prior the Indiana and Texas have started to reopen while Louisiana remains shutdown. Of the three states that saw slight upticks, Georgia and Ohio have reopened while Connecticut remains shutdown.
Must of the states that saw their rate of infection decrease remain shut down, although Colorado and Pennsylvania have seen at least partial reopening.
Because it can take 10 to 20 days for new cases of COVID-19 to manifest and start showing symptoms, we need at least another week or two of data to determine whether the reopening has caused a surge in cases as many models predict. Of course, these models have been dramatically overestimating hospitalizations and deaths from the beginning of the outbreak, so we’ll wait for new data before we draw any conclusions about the safety of reopening.
To put today’s data in perspective, you can look back at data from yesterday or a week ago.


