
Reported cases of COVID-19 in the U.S. rose by 28,241 to 728,094 in the past 24 hours, an increase of 4 percent. This is the slowest case growth yet. Unfortunately, deaths grew 2,818 to 34,726, an increase of 9 percent.
Despite the bump in reported deaths, data confirms that the country is finally on a downward slope as you can see in this chart from the New York Times, which shows new cases and the 7-day moving average.
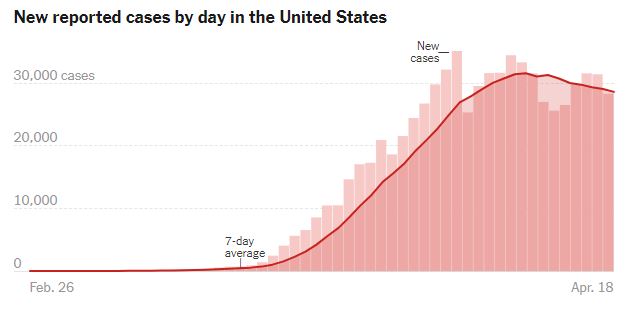
Globally, cases grew 82,000 to 2.355 million, a decrease from yesterday’s increase of 90,000. Global growth has now slowed to 4 percent. The global death toll climber to 161,402, its smallest increase in weeks.
State Growth Slows
Here’s a look at case growth over the past 7 days in the states with the highest disease rates:
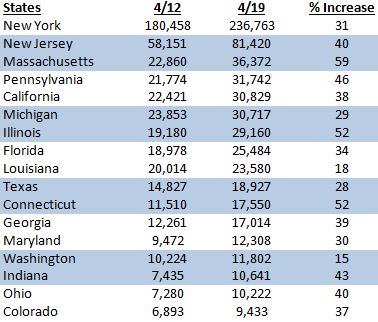
Compared to the map from a week ago, you will see that we added Maryland and Ohio, which are working their way up the chart. Michigan dropped three places while Louisiana sank two spots. Pennsylvania climbed two spots to fourth place with more than 30,000 cases.
The good news is that every state, including those that moved up the chart in terms of case count, saw the rate of increase drop significantly. This week, only three cases saw an increase of 50 percent or more. Last week, 14 were above a 50 percent mark and three had growth rates above 100 percent.
As you can see in the lead graphic, hospitalizations in New York have been dropping, which is good news. In fact, much of the data from new York was positive as new case growth is in the low 7,000s per day, well below the 10,000 mark the city repeatedly hit. The 540 deaths over a 24-hour period were the lowest in two weeks.
COVID-19 Case Concentration
New York has seen more cases of COVID-19 than the next six states combined. If you look at the Tri-State area (New York, New Jersey and Connecticut), they account for 46 percent of the total cases in the U.S. Throw in Massachusetts, and those four states in the North East account for more than half the cases in the country.
That’s something to think about when it comes time to discuss re-opening states.
Reopening any of the hard-hit urban areas is going to be an epidemiological challenge. Governors in cases like New York, Michigan and Louisiana, where most of the cases are concentrated in small areas of the state, will have a fine line to walk., as recent protests have shown Some of them say their decisions are driven by the data. OK, but will they be looking at disease data or political data?
To put these numbers in perspective, we encourage you to look back at data and news from yesterday or a week ago.


